
「FXで月10万円稼ぎたい!」「FXで損失は少なく安定して稼ぎたい!」こんな風に考えている人は多いのではないでしょうか?月10万円という金額は、FX初心者にとって最初の目標になると思います。
この記事では、FX初心者が月10万円稼ぐ方法や損失を少なくしつつ安定して勝ち続ける方法について解説します。
FXで安定して月10万円稼ぎたいという人は、ぜひ最後まで読んでみてください。FXの成功に近づくことができるでしょう。
【FXで最速利益を出す秘訣】
FXで効率よく利益を出す最大の秘訣は、自分に合ったFX口座を使うことです。
「稼げるFX口座が分からない」「どの口座を開設するか迷っている」という方は、以下のFX口座を2つとも開設しておき、両方を1ヶ月使ってみて自分に合う口座を使い続けるのがおすすめです!
どちらも完全無料で口座を開設できるので、気軽に開設して、使い勝手を自分の目で確かめてくださいね!
FXで月10万を稼ぐ人が実際に使っているFX口座
FXで稼ぐにあたって1番大事なことは、FX口座選びです。
なぜなら、FX会社はたくさんありますが、自分に1番あったFX口座を選ばなければ成功できないからです。それぞれのFX会社には良いところと悪いところがあります。自分のトレードスタイルに合うものを選びましょう。
また、そのほかにもFX会社を選ぶポイントがあります。自分に合うFX会社を選ぶことはもちろん大事ですが、これから説明するポイントも頭に入れておいてください。ポイントは4つあります。
- 口座開設数が多い
- トレーダーの口コミ数が多い
- スプレッドが狭い
- サポートが充実している
口座開設数が多いFX口座は、投資家からの人気もあります。また、口座開設数の中のFX初心者の数にも注目するとなお良いです。
また、実際に利用している人からの口コミも口座選びに重要なポイントです。良い評判が多いと安心して口座を開設することができます。
スプレッドが狭い口座は、必要なコストが少なくて済みます。安定して10万円稼ぐためにはコストを少なくするのも大事です。また、サポートが充実しているFX会社もおすすめです。24時間お問い合わせできたり、LINEでお問い合わせができるととても便利です。
これら4つのポイントを押さえたうえで、自分のトレードスタイルに合ったFX口座を選択しましょう。ここで、おすすめなFX会社を3つ紹介します。参考にしてみてください。
| FX会社名 | 通貨ペア | 手数料 (1ドルあたり) | スプレッド(米ドル円) | スワップポイント | 最低取引単位 | キャッシュバックキャンペーン・特典 |
|---|---|---|---|---|---|---|
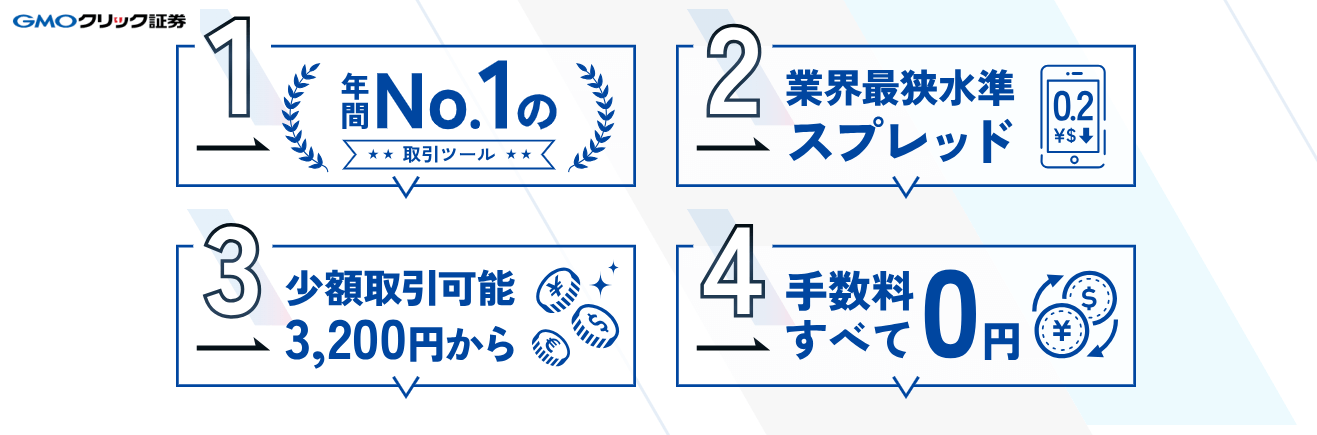
| 第1位 GMOクリック証券 | 20種類 | 無料 | 0.2銭* | 1,000通貨 | 最大55万円 | |
| 第2位 外為オンライン | 26種類 | 無料 | 1.0銭 | 1,000通貨 | 最大15万円 | |
| 第3位 GMO外貨 | 24種類 | 無料 | 0.2銭** | 1,000通貨 | 最大55万円 |
*GMOクリック証券のスプレッド(米ドル円):0.2銭(原則固定)
**GMO外貨のスプレッド(米ドル円):0.2銭(原則固定)

どのFX口座を開設しようか迷っているのであれば、上記の3社から選んでみてくださいね!
FXで月10万を初心者が儲けるコツ!
では実際に、FXで月10万円稼ぐにはどうすれば良いのでしょうか?
FXで月10万円を稼ぐためにおすすめしたいことは、1万通貨単位で取引をすることです。これには理由があります。月に10万円稼ぐことを考えたときに、一度の取引で1000円の利益を目指したとします。
そうすると、100回取引をすれば10万円の利益を得ることができます。1万通貨単位で取引をしたとき、0.1円(10pips)の値幅を取ることができれば1,000円の利益を出すことができます。
1万通貨単位で取引をし、1回の取引で1,000円の利益を出し、それを月に100回繰り返すというのが初心者には一番おすすめの方法です。
とはいっても、最初から1,000円の利益を100回出すことは簡単ではありません。まずは、1回1,000円の利益を出すことを目標にし、それが達成できれば10回、20回…、100回と少しずつ目標回数を増やしていきましょう。
月100回できるようになれば、10万円の利益を得ることができます。単純計算ですが、そのためには1日最低3回は取引しなければいけません。1日3回以上0.1円の値幅を取ることができれば月10万円を手に入れることができます。
FXで月10万を初心者が稼ぐにはスマホアプリ必須
初心者が月に1000円の利益を100回繰り返す時に、スマートフォンのアプリは必須です。
100回取引をするためには、1日3回以上取引をする必要があります。例えば、日中仕事をしている人にとっては、取引する時間が限られてきます。
そのような人たちにとって、通勤時間やお昼の休憩時間などの隙間時間は貴重な取引に使える時間です。
そのような隙間時間に取引をするために必要なのが、スマートフォンです。スマホがあればいつでもどこでも取引をすることが可能になります。
最近では、スマホの普及により、パソコンよりもスマホで取引をする人が増えています。ベテランのトレーダーもスマホを使って取引をしている人が多いです。
また、スマホでの取引機能の開発に力を入れているFX会社も増えてきています。そのため、スマホの方が取引が分かりやすく、簡単になっている場合もあります。
スマホで取引をする際、ブラウザよりも専用のアプリを使う方が便利です。なので、口座開設をしたFX会社のスマホアプリはダウンロードしておきましょう。
FXのスマホアプリ対応おすすめFX会社
FXのスマホアプリに対応しているおすすめのFX会社を紹介します。おすすめのFX会社は「GMOクリック証券」と「GMO外貨」です。これらの特徴についてまとめたので参考にしてください。
| GMOクリック証券 | GMO外貨 | |
|---|---|---|
| キャッシュバック金額 (2024年4月現在) | 新規開設+取引で 最大550,000円 | 新規開設+取引で 最大550,000円 |
| 取引単位 | 1,000通貨 (※南アフリカランド/円とメキシコペソ/円は10,000通貨) | 1,000通貨 |
| アプリ対応 | 〇 | 〇 |
| スマートフォンWeb | 会員ページ | 外貨ex ブラウザ版取引画面 |
| スマートフォンアプリ | GMOクリックFXネオ | 外貨exアプリ |
| デバイス | iPhone/Android | iPhone/Android |
GMOクリック証券とGMO外貨はどちらも、スマホアプリがあります。iPhone、Androidどちらにも対応しています。
スマホアプリを活用することで取引が楽になり、時間と場所に縛られることがなくなるのでおすすめです。
FXで月10万稼ぐために損失を抑えるコツ
ここまでの説明を聞いて、FXで月10万円の利益を出すのは案外簡単かもと思った人もいるのではないでしょうか。しかし、初心者にとってはそう簡単ではありません。1回の取引で0.1円(10pips)の値幅を取るのは大変なことです。
初心者は、初めのほうは損失を出してしまうことがよくあります。まずは、取引に慣れることから始めましょう。目標の0.1円(10pips)まで粘り強く取引を続けることが大切です。
また、初心者が月10万円を稼ぐためには、損失をいかに出さないかがポイントになってきます。利益を多く出しても、損失が多ければ最終的な収入は10万円に達しません。そこで、損失を抑えて取引をするコツを3つ紹介します。
- スプレッドが狭いFX会社を選ぶ
- おすすめの通貨ペアは米ドル円
- 損切と相場のイメージを持つ
これら3つのポイントについて詳しく説明します。
FXで月10万円達成するためにはスプレッドが狭いFX会社を選ぶ
1つ目のコツは、スプレッドが狭いFX会社を選ぶことです。
FXの取引をするときに、取引手数料がかかります。日本国内のFX会社の多くは、取引手数料は無料であることが多いです。その代わりにFX会社は、「スプレッド」を収入源としています。スプレッドが狭いほど手数料は低くなります。
スプレッドとは、買値と売値の差額のことです。例えば、米ドル/円のAskが110.002円でBidが110.000円の場合、スプレッドは0.002円となります。スプレッドが小さいほど取引にかかるコストは小さくなるので、スプレッドはなるべく小さいものを選びましょう。
スプレッドが0.2銭の場合の、各通貨単位ごとにかかる手数料の違いについて見てみましょう。
| 通貨単位 | スプレッド |
|---|---|
| 1通貨 | 0.002円 |
| 10通貨 | 0.02円 |
| 100通貨 | 0.2円 |
| 1000通貨 | 2円 |
| 10000通貨 | 20円 |
先ほどおすすめした10000通貨での取引場合、スプレッドは20円になります。20円であればたいしたことないと考える人もいるでしょう。しかし、20円のスプレッドで100回取引をしたとき、合計のコストは2000円になります。月10万円の収入を手にするためには、103,000円は稼ぐ必要があります。
「ちりも積もれば山となる」ということわざのように、スプレッドを甘く考えてはいけません。スプレッドが0.2銭の会社と0.3銭の会社があったとすると、ぱっと見そこまで差はないように感じます。しかし、10000通貨で月に100回取引をすると、その差は1000円になります。それを1年間続けたら12000円になります。そのため、スプレッドは少しでも小さいほうがいいです。
FXを始める際は、「スプレッド」のこともしっかり考えましょう。スプレッドの狭いFX会社を選ぶことをおすすめします。
FX初心者にはドル円がおすすめ
2つ目のコツは、米ドル円の通貨ペアで取引をすることです。
米ドル円は初心者におすすめの通貨ペアです。なぜなら、米ドル円は比較的スプレッドが狭く、低コストで取引をすることができるからです。
また、日本にいても米ドルは馴染みのある外貨だと思います。有名な通貨で情報も入りやすいため、初心者でも取引がしやすいです。
また、スプレッドは通貨ペアごとに異なります。そのため、米ドル円以外の通貨ペアで取引がしたい人は、最初はなるべくスプレッドの狭い通貨ペアを選ぶのが良いでしょう。
損切と相場のイメージを持つ
3つ目のコツは、損切りと相場のイメージを持つことです。
初心者に限りませんが、FXで損失を出さないためには「損切り」が重要になってきます。特に初心者は、慣れるまで損切りのタイミングが掴みづらいので気を付けなくてはいけません。
FXの相場は常に上下に動いています。1日や1週間単位で見ると常に相場が上がり続けていたとしても、1分や30分単位でみると上がったり下がったりしています。小さい上下に動く波が積み重なって、大きな波、つまり相場が作られるというイメージです。
そのため、含み損を経験することなく利益を生み出すというケースはほとんどないです。含み損を抱えたときに頭に入れなくてはいけないのが「損切り」です。損切りが早すぎると利益を出すチャンスを逃すかもしれないし、損切りが遅すぎると損失が拡大してしまいます。そのため、損切りのタイミングというのはとても重要なんです。
初心者は含み損が出たときに、決済をすると損失が確定してしまうという恐怖から、なかなか損切りできない人が多いです。損失を少なくするためには早めの損切りが大事なので、自分で決めた以上の損失が出たら損切りをするようにしましょう。マイルールを作ると損切りがしやすくなります。
FXで月10万稼ぐためにはスワップ金利狙いもおすすめ
FXでは、取引以外の方法でも利益を出すことができます。それは、スワップ金利を活用する方法です。
スワップ金利とは、二つの国の通貨間の金利の差のことです。日本円のような低金利の通貨を売り、豪ドルのような高金利の通貨を買うことで、その金利差を受け取ることができます。一度に受け取れる金額は小さいですが、金利差は毎日受け取ることができるので、長期的に見ればしっかり稼ぐことができます。
高金利通貨として、豪ドルがおすすめです。高金利通貨には、トルコリラなど高金利の通貨は他にもあります。しかし、金利が高いのは「金利が高い=金利を上げないと誰も買ってくれない」という意味でもあります。マイナーな国の通貨は、金利が高くてもその分リスクもあるので気を付けましょう。
スワップが高いFX会社
スワップ金利はFX会社によって異なります。そのため、スワップ金利で利益を得るのであれば、スワップ金利が高いFX会社を選ぶ必要があります。そもそも高金利通貨を取り扱っているのか、取り扱っている場合スワップ金利はいくらなのか、確認しておきましょう。先ほど紹介した豪ドルを取り扱っているFX会社を紹介します。
- GMOクリック証券
- GMO外貨
これら二つのFX会社は、豪ドル円だけでなく、メキシコペソ円や南アフリカランド円などの高水準のスワップ金利の通貨ペアを取り扱っています。
FXで月10万円稼ぐまとめ
FXで月10万円稼ぐためには、1か月で1万通貨単位の取引で1000円の利益を出すことを100回繰り返すのがおすすめです。
そのためには1日3回以上取引をする必要があり、スマホのアプリがあるととても便利です。また、取引だけではなくスワップ金利も利用するようにしましょう。
FX初心者でもFXで月10万円稼ぐことは可能です。そのためにもFX会社はしっかり選びましょう。FX会社選びがFXで月10万円稼ぐためのカギといっても過言ではありません。この記事で紹介したことを実践し、FXで月10万円を稼げるようになりましょう!